
Making the Mad Men Inflation Calculator
Little insights on how I went about creating the Mad Men Inflation Calculator.


I recently launched the Mad Men Inflation Calculator. Although it's not the hardest project I've ever worked on, it definitely was a fun one to make, and I thought it would be a good idea to write about how I ideated, validated it with Reddit and Google Trends and developed it.
The problem
I'm a huge Mad Men fan. I've watched and rewatched the show close to ten times already (Hey, I really, really, really like it).
For those of you who don't know it: Mad Men is a show about New York ad men working in an ad agency in the 1960s. It's really a drama pur sang, and did I mention already that I really like it?
So as I mentioned it takes place in the sixties. Every time they mention some amount of money on the show, I can't help but wonder what that amount would be in 2019, taking inflation into account.
First, I'd have to check which specific year it would be in the show. The series starts in 1960 and "Person to Person", the final episode of the series, takes place in 1970.
Then I'd have to find an inflation calculator, enter the correct year and finally I would see that the $5,000 they're talking about in 1960 is a little over $43k in 2019. Wow, Don Draper was loaded!
What if there would be a better way to calculate this? A specific Mad Men Inflation Calculator would tell you exactly which year corresponds to which season. (I told you this wasn't the hardest project I've ever worked on).
I found there was a WolframAlpha calculator, which you can find here, but that doesn't show the last 3 seasons and doesn't work as smooth as I expected.
The Validation
Okay, so I'm having this problem. I'm not going to spend some hours crafting a solution that only scratches my itch. I want it to scratch a load of people's itches!
So first, I checked out Google Trends and saw this:
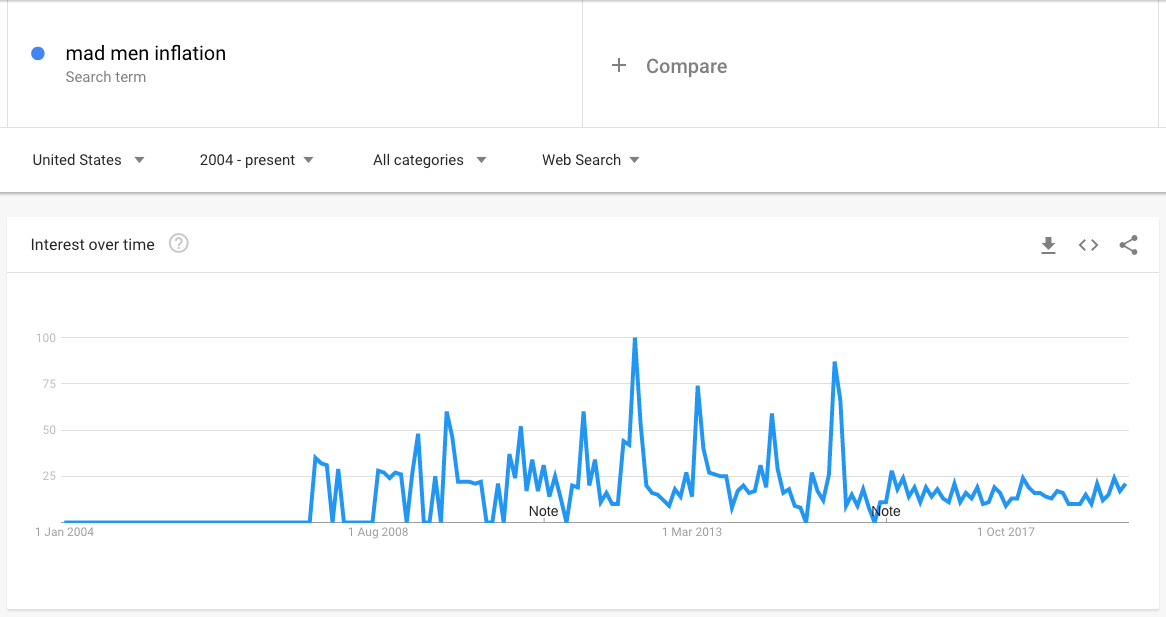
Oh yeah, I forgot to mention that the last episode of Mad Men aired in May 2015. So the timing is not ideal, as Mad Men is past its peak. It's still on Netflix but it obviously doesn't get as many viewers each month compared to when it just came out.
Note that Google Trends does not really give any real data as such. The title of the graph is "Interest over time", where the scale of the Y-axis is the interest, where 100 is peak popularity.
So we see that in 2019 (on the right of the graph), the popularity of the term "mad men inflation" in Google is 1/10th of its peak popularity in 2012 when season 5 came out. We don't exactly know how popular the term was in Google back then, it can be that there were 100 monthy searches or 1 million. All we know is that that period it was the most popular that it's ever been.
Conclusion: It's not as popular as it used to be - makes sense. But we need some real data.
What we need is some real data. Ideally we need to find an online hub where a lot of Mad Men fans are all together to talk about the show.
Well, we're in luck, because there is an /r/MadMen subreddit. It has 60.8k fans that come together to talk about the show, even years after its last episode aired.
Let's see if a lot of people are like me and use an inflation calculator.
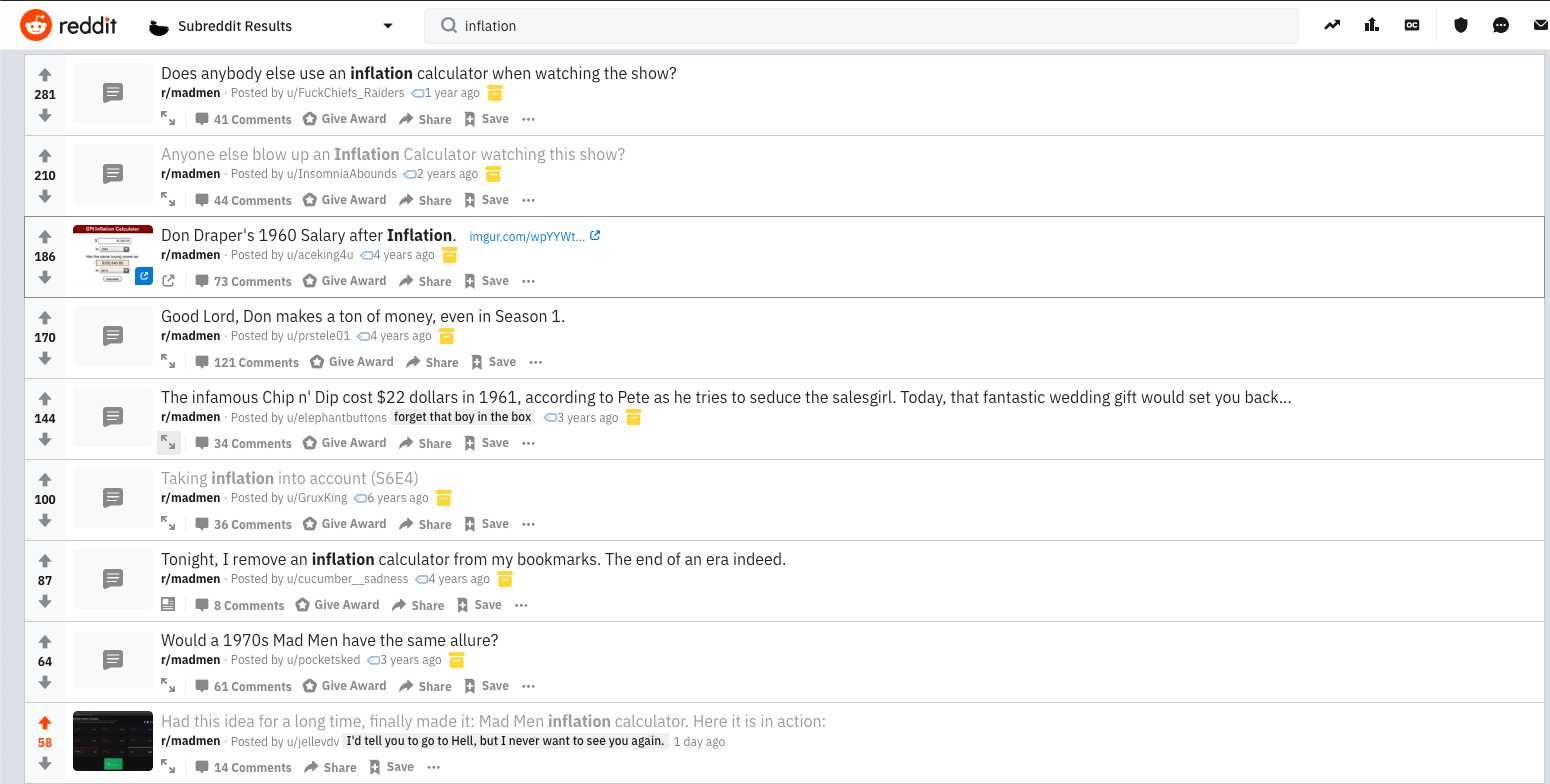
Great, there are some threads about it with some solid amount of upvotes.
Looking at the comments in those threads, it shows that, in fact, quite a lot of people use different kind of inflation calculators. On top of that, there's also a Tumblr called Don Draper's Money that translates the Mad Men expenses to today's currency.
Okay, we can conclude that people are interested in comparing 1960 dollars to 2019 dollars. The bad thing is that Mad Men is obviously past peak popularity, so it won't go viral anymore, but it will definitely help some people who still watch the show. Also, we know from experience that the current calculators are not good enough, we need a specific calculator so that we don't have to search which year it was in each season.
The Solution
So in the end I created this:
First, you'll notice that all the seasons are listed, with the corresponding 196x year below it. This way people won't have to search for it anymore, but would see it right away. Check ✅.
The box with the red top border indicates the year/season we use as the base-year for our calculation.
Take the next screenshot for example:
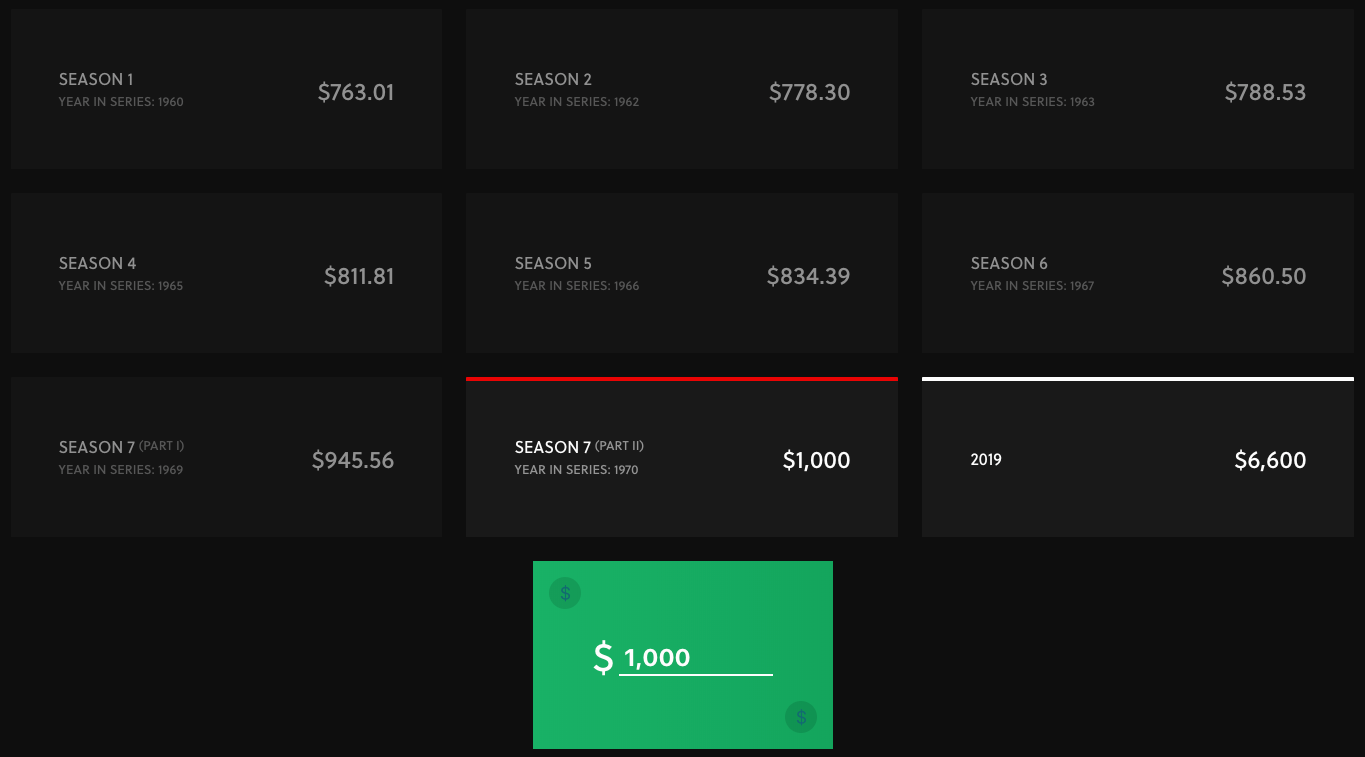
We entered $1,000 in the green square, and see that $1,000 dollar in the 7th season (part 2), which corresponds to 1970, equals $6,600 in 2019 taking inflation into account.
Want to check what $1000 1960 dollars would be worth in 2019? Simply click on the Season 1 box or drag the green dollar to that box, and it will recalculate it on the fly. Again, not the hardest thing to create with React, but I'm convinced this is an elegant and user-friendly solution.
The technical aspects
It's built with my Gatsby starter project that has a connection with Firebase, latest React, SEO and other stuff built in. Thanks to this starter I managed to go from sketch to live website in around 4 hours 🚀.
As you can see in the GIF a few sections up, there's a fun (imo) feature that allows you to drop the green dollar to a season and on drop it will recalculate the dollar amounts. I used React DnD for this, and I can't suggest this tool enough if you're looking to add drag and drop functionality in your React App. It allows you to use hooks as well, so your components stay super clean and there's no need for class components anymore.
The project is hosted on Firebase and with a little Nginx proxy_pass magic I can show it as a path on my website (vandevliet.me/madmen-inflation-calculator) instead of having to buy a separate domain or as a subdomain.
Closing remarks
This is a little insight on my process for building new side-projects. As I've mentioned in a previous blogpost, a key for me is validating the project. Even though I built this project in 4 hours and at first it was mainly to scratch my own itch, it's more fun to create things that you know that will be used by other people.
I posted it on Reddit as soon as I put it live. It got some 50-odd upvotes, which was less than I expected to be honest. I posted it as a video, because I was afraid a direct link might not work as good. That was probably not a good idea. The video is not that clear on mobile, so a lot of mobile users won't upvote it. I should've thought about that, tbh.
I then approached it ProductHunt style and wrote a comment in the thread, with some info on why I built it with a link to the tool.
I also contacted the owner of the Tumblr mentioned previously with a link to my tool, but as the last post of the Tumblr was in 2017, I'm not sure if I'll ever get an answer. We'll see.
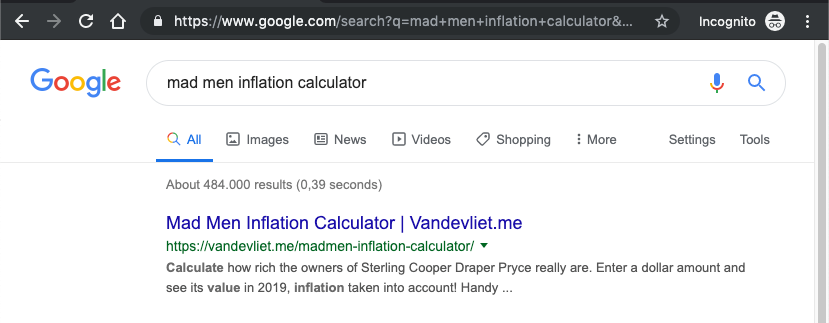
I requested indexing in Google Search Console and I see it popping up in the Google SERP already for some relevant keywords. So over the couple of weeks/months I'll see exactly how many people search for a tool like that, and I can adapt my marketing experiments.
Keep you updated!